
New research looking at federal government policy decisions, demographic shifts and market volatility between 2002 and 2016 has found that policy reform factors have the largest role in decreasing overall income inequality among Australians, with the greatest reductions occurring while Labor is in power.
Researchers from the University of Canberra conducted a year-on-year analysis of Australia’s income inequality both before and after the Global Financial Crisis and uncovered inequality’s major drivers by untangling the complex interactions in both the social and economic environments.
The paper1 found that government policy decisions played the largest role in tackling inequality with the greatest average reductions occurring during years when Labor was in power compared with the Coalition.
Pushing the other way, the research also found that market income changes due to factors such as job losses or wage cuts was the biggest driver of inequality for those on all levels of income.
Because many factors lie behind income inequality change, it was not possible to simply examine observed inequality levels to determine whether policy changes had led to any meaningful change, Dr Jinjing Li of the University of Canberra’s Institute for Governance and Policy Analysis and lead author of the paper told Lab Down Under.
To get around this difficulty, the study examined four key components — tax transfer polices, demographic change, market income change and other factors — and compared these to the year-on-year change in inequality measures such as the Gini Index (a measure of the distribution of income across income percentiles in a population) as well as ratios across different segments of Australia’s income distribution.
The Gini Index consists of numbers lying between zero and one, with zero representing perfect equality and one representing perfect inequality.
Policy and its influence on inequality
While the study revealed that, for most years, policy reform tackled inequality regardless of whether Labor or the Coalition were in power (driving down the Gini by 0.017 across the board), there were still clear differences in how these parties’ policies affected inequality in Australia.
“From the data available to us, the following picture emerges: on average, there is more reduction in inequality due to policy changes in years when Labor is in power compared with the years when the Coalition is in power,” Dr Li said.
While policy was a “large contributor” to changes in the overall income distribution between 2002 and 2016, especially outside the financial crisis period of 2006 to 2009, these changes mattered more for those in the bottom half of the income distribution, Dr Li said.
A tax cut to high income earners offered by the Howard government in the 2006-07 financial year also worsened inequality, the study found.
“Generally, changes in the tax and transfer policy system in Australia reduce overall income inequality, except for the 2006–07 financial year when a large tax cut was implemented,” Dr Li said.
“This particular tax reform also had the largest effects on the lower end of the income distribution, increasing income inequality in this poorest part of the population during this period.”
In contrast to the rise in inequality due to the tax cuts of 2006-07, there was a sharp decline in inequality in the poorest part of the population in 2010 when Labor was in power, Dr Li said.
“This decline was largely due to the increased rate of the age pension under the Labor government which … is the single largest welfare payment in Australia. Retirees receiving the age pension tend to be in the bottom quartile of the income distribution given the income test constraints of the benefit.”
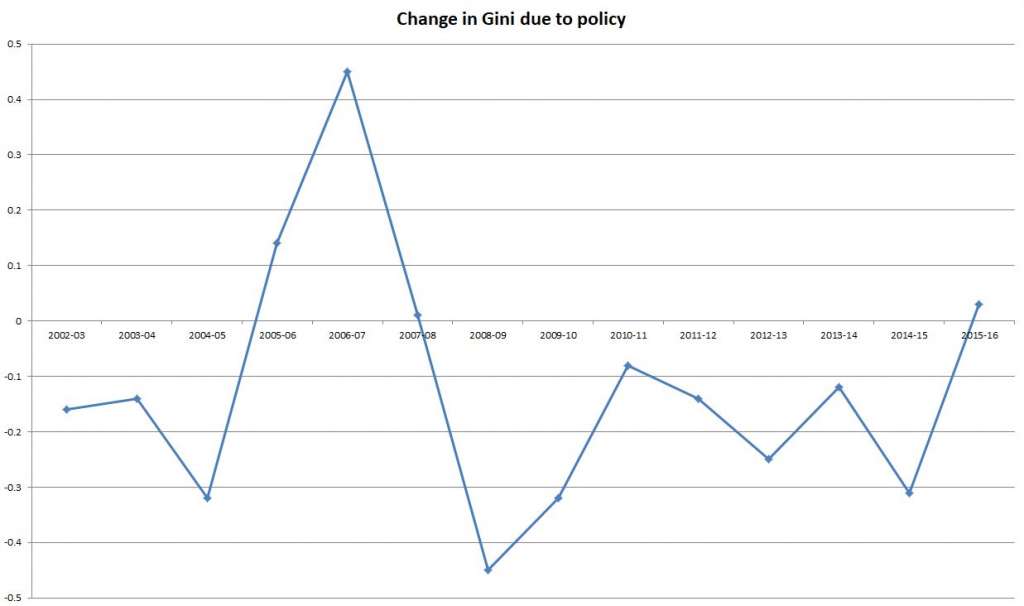
Image 1: Change in Gini due to policy decisions from 2002 to 2016. Coalition (2002-2007), Labor (2007-2013), Coalition (2013-2016).
Reduced inequality from the GFC
While policy reform dropped the Gini during the period examined, changes in market income actually raised the Gini by 0.014, resulting in higher levels of inequality.
Market income is defined as a household’s total pre-tax income from wages, salaries and investments and can be affected by wage cuts and periods of higher unemployment.
Poorer Australians experienced the largest effects from these market income changes on average, the study found.
However, there were differences between before and after the GFC. Inequality increased in 2006 and 2007 (accompanied by a rise in the Gini of over 0.010). In contrast, inequality dropped in 2007 and 2008 (with the Gini decreasing by over 0.012).
The finding that much of these inequality shifts came from changes in market income, particularly in the years before and after the GFC, was expected, Dr Li said.
As for the period from 2002 to 2016, this was selected in the study because Australia experienced a range of changes during this time.
“Demographically, Australia faced an ageing population despite a relatively large number of young immigrants. The welfare system has seen major reforms aimed at reducing welfare dependency and promoting self‐reliance through paid work. Economic growth enjoyed the mining boom but at the same time suffered from the global financial crisis. In other words, many things have changed – which makes it possible to estimate the impacts,” Dr Li said.
‘Actual inequality is more than just income’
Dr Li suggested that these results could be further built on in a number of ways, including extending the time beyond the 14-year time period chosen.
“Due to the limit of this particular dataset, we could not go as far back in time as much as we wanted,” he said.
Secondly, it might be interesting to examine particular social groups instead of the general population, Dr Li added.
“The income for singles parents, for instance, tends to be more sensitive to labour market conditions and welfare policies.”
Finally, the definition of inequality itself could be expanded upon in future research.
“This paper looked at income inequality, but actual inequality is more than just income – think wealth, general well-being and opportunities, etc. It would be important to identify the underlying drivers of the broader inequality evolution.”
The current results also give some insight into how governments could balance tax transfer policy that governs taxation and social welfare systems with the impact of market income changes.
“If tax transfer policy reform becomes harder to implement due to the limited fiscal space, it might be worthwhile to consider policies that can lower gross market income inequality,” Dr Li said.
“These could include policies that promote gender equality, increase union power, cap top earnings, etc. They could be potentially cheaper and just as effective in lowering income inequality in Australia.”
Author’s note: If you enjoyed this article, you can follow Lab Down Under on Facebook or support me on Patreon. I also have my own personal Twitter account where I’ll be sharing my latest stories and any other items of interest. Finally, you can subscribe here to get my weekly blogs in your inbox.
1 Li J, La H, Sologon D. Policy, Demography, and Market Income Volatility: What Shaped Income Distribution and Inequality in Australia Between 2002 and 2016? The Review of Income and Wealth, 08 April 2020.
Featured image: Inequality Poverty Homeless. Picture by Manuel Alvarez from Pixabay. Used under the Pixabay Licence.