In February and March 2014, a fire at Victoria’s Hazelwood coal mine burnt for 45 days, sending dense plumes of smoke over the nearby town of Morwell, threatening the state’s electricity supply, and ultimately resulting in a government inquiry and a $2 million Supreme Court fine for one of Australia’s worst air quality incidents on record.
To aid a wider research goal of investigating the health effects of the fire on Morwell residents, a group of scientists from the Commonwealth Scientific and Industrial Research Organisation (CSIRO) have developed an atmospheric model of how the smoke coming off the Hazelwood coal mine was distributed across the nearby area while the fire burned.
A new paper on the modelling published in Atmospheric Environment1 was headed by Dr Ashok Luhar, principal research scientist and team leader at CSIRO Oceans and Atmosphere in Aspendale, Victoria. Dr Luhar sat down with Lab Down Under to discuss how the model worked and what it revealed about the fire.
Filling in the data gaps
The modelling itself is part of the Hazelwood Health Study2 which was commissioned by the Victorian Department of Health and Human Services and brings together a range of research streams that are led by scientists from Monash University in collaboration with Federation University, University of Tasmania, University of Adelaide and the CSIRO.
“The objective of the CSIRO’s modelling research was to reconstruct the spatial distribution of smoke levels due to the mine fire in and around Morwell through air quality modelling, which was needed in health studies being conducted mostly by Monash University,” Dr Luhar told Lab Down Under.
The model was designed to estimate atmospheric smoke due to open fires at the local town-scale rather than at a wider regional, state or continental level.
In their modelling, the CSIRO examined two smoke constituents that have major health implications: PM2.5 particles (fine airborne particles which have a diameter of 2.5 micrometres or less) and carbon monoxide.
The model covered gaps in data collected during the time of the fire itself, which burned from February 9 to March 25, Dr Luhar said. At the time of the fire, not only was air monitoring conducted at only two points in the town, but it was only commenced a few days after the fire started.
“Precision air monitoring started quite a bit later after the start of the fire, and our modelling was able to reconstruct the smoke levels over Morwell during that early period and also over the whole town for the full duration of the fire,” Dr Luhar said.
Analysing a smoke-covered town
This lack of air monitoring in the early days meant existing data failed to include the time when the smoke levels were at their highest, just after the fire ignited until a few days later when the wind took the smoke away from the town.
The modelling revealed that the fire was the most intense and widespread over the first two days, which resulted in the highest emissions.
“This, coupled with Morwell being directly downwind of the mine fire, led to the highest smoke levels for the town. This occurred while the air monitoring had not yet commenced in the town,” Dr Luhar said.
Both PM2.5 and carbon monoxide exceeded Australian air quality standards over Morwell several times while the smoke poured over the town, the modelling found.
However, a lucky break and a change in wind eventually resulted in Morwell’s residents being spared from the worst effects of the smoke a few days after that.
“It was also found that over the third and fourth days of the fire, although the mine fire emissions were still very high, Morwell avoided high pollution events by being under favourable wind conditions which moved the smoke plume away from most of the town,” Dr Luhar said.
Low quality coal, high smoke levels
Smoke emissions from the fire were so high particularly because the coal in the mine was brown coal, also known as lignite, which is the lowest ranked coal due to its relatively high moisture and low heat content, Dr Luhar told Lab Down Under.
“This generally means that the amount of fine particles, PM2.5, emitted into the atmosphere per kilogram of brown coal burnt during the Hazelwood fire was higher than if this was a better quality of coal like bituminous or anthracite.”
With the fire feeding off this lignite, the smoke plume itself remained relatively low in height, causing higher levels of smoke near the ground than would have been expected if the mine was full of higher quality coal, Dr Luhar added. These ground-level emissions of smoke were produced by the relatively lower levels of heat in the blaze.
“The heat influences the buoyancy of the plume. So the more intense the combustion or the more heat is generated by the combustion, the higher the buoyancy of the plume and the higher its elevation from the ground, which moves the smoke further up into the atmosphere,” Dr Luhar said.
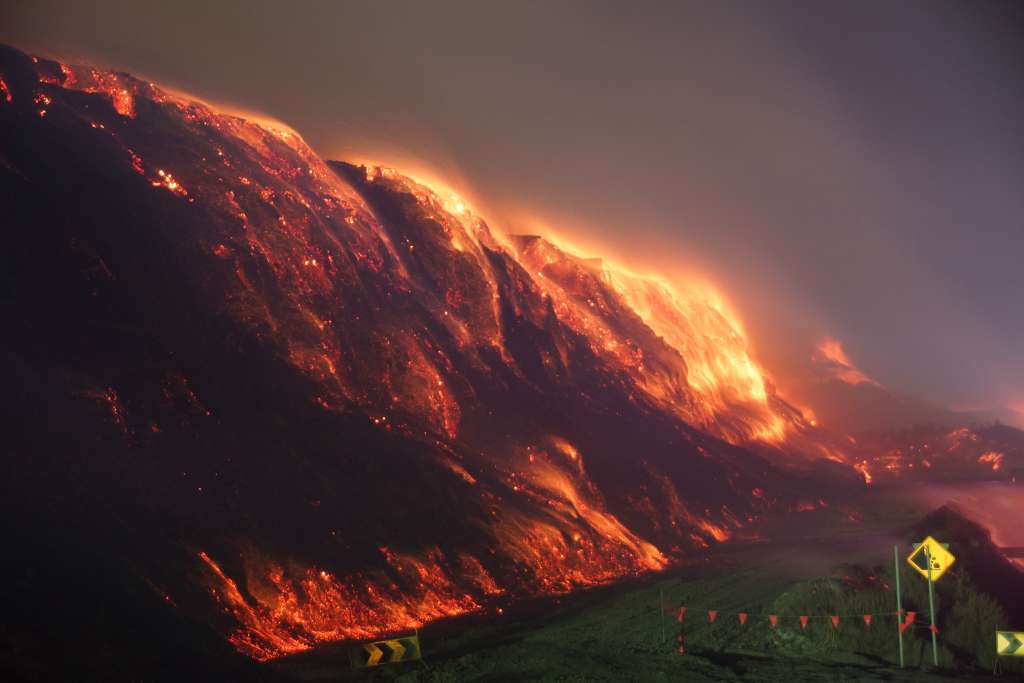
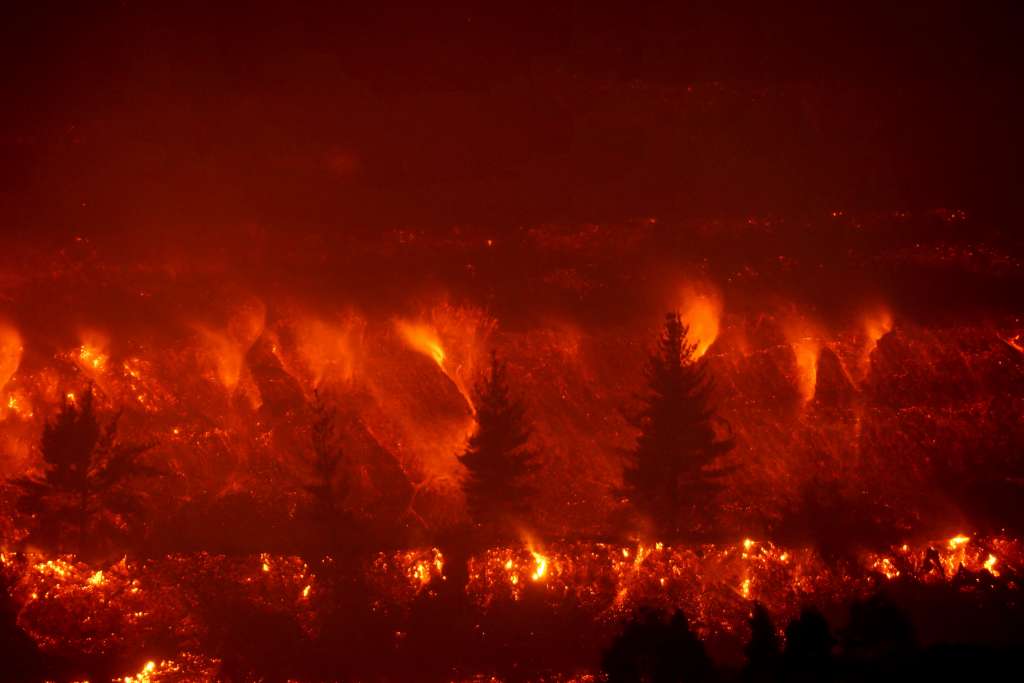
Image 1: Open Cut mine fire at Hazelwood plant in Morwell February 2014. Picture by Keith Pakenham. Used with permission from the Country Fire Authority.
Three steps for an accurate smoke model
The CSIRO’s smoke modelling contained three essential components: emissions (PM2.5 and carbon monoxide), local meteorology data, and dispersion and transport.
“The emissions component calculated how much smoke was being emitted every hour using a variety of information such as the area and amount of coal burning, the amount of smoke produced per kilogram of coal, and fire behaviour in response to changes in hourly weather conditions,” Dr Luhar said.
The meteorological component then added local wind patterns and turbulence, calculated on an hourly basis.
“Using information from these two components, the third component, dispersion and transport, then simulated the plumes of smoke emissions in the atmosphere and provided hourly concentrations of smoke at 100-metre spatial resolution in and around Morwell.”
Separate modelling was also conducted looking at background smoke levels at the time of the Hazelwood fire, which were found to be negligible compared to the smoke coming from the mine.
An approximation of reality
When asked about the limitations of the CSIRO’s modelling, Dr Luhar pointed out that all mathematical models are approximations of reality. This is especially true for atmospheric modelling which has to include the stochastic, or random, nature of atmospheric motion at the town-scale.
Furthermore, the quality of the data input into the model ultimately determines the model’s output performance.
For the Hazelwood fire model, input data included estimates for the amount of pollutants released per kilogram of lignite burnt, which were termed emission factors, as well as the depth of the coal consumed over the fire’s duration.
“The emission factors needed to be refined for the type of coal used at Hazelwood. That was one limitation where the emission factors were not accurately known and which we had to estimate,” Dr Luhar said.
“The depth of the coal consumed over the duration of the fire was also very important in the estimation of the emissions but was not known, and had to be estimated from the scientific literature.”
Dr Luhar told Lab Down Under that he remained confident about the accuracy of the model’s outputs despite these limitations, particularly since the modelled smoke levels had been validated by the measurements taken at Morwell.
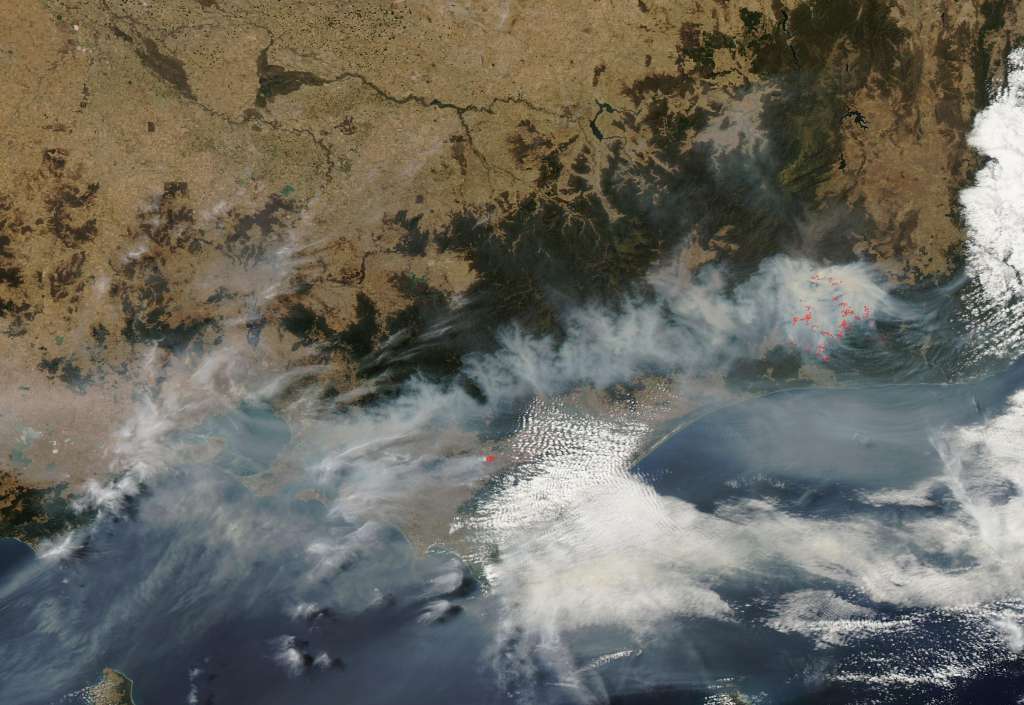
Image 1: Satellite imagery showing smoke over Victoria on 11 February 2014. The smaller red dot in the centre is the Hazelwood mine fire while the multiple red dots to the right are from the Snowy River Complex fires. Image by LANCE/EOSDIS MODIS Rapid Response Team at NASA GSFC.
Bettering our understanding of fire
Usually, smoke emissions are difficult to determine. One area that could be used to further develop the CSIRO’s model is creating an inverse modelling approach that estimated emissions using atmospheric measurements of smoke, Dr Luhar said.
“What we have done in this paper is forward modelling, so given the estimated source emissions you determine the ambient smoke levels. But if you have good quality ambient smoke measurements, you can go backward in time from these measurement points to the source area to calculate emissions. That’s inverse modelling.”
While the Hazelwood model examined a local town-sized area, the CSIRO is also working with and developing atmospheric pollution transport models that look at larger areas across regions, states or even the entirety of Australia and beyond.
These larger models rely on different chemical and physical properties and processes than their smaller-scale counterparts. The CSIRO is currently comparing these models with real-life measurements from bushfires, including this year’s Black Summer bushfires, to hone the models, which can then be used in health studies of interest.
However, there are still plenty of areas where further research could be used to enhance these types of models and their ultimate health outputs, Dr Luhar said.
“Certainly more studies are needed to better understand how fire plumes behave, the factors influencing smoke emissions, how large fires impact local weather, and effective ways to assimilate available weather and smoke data to improve model performance.”
Author’s note: If you enjoyed this article, you can follow Lab Down Under on Facebook or support me on Patreon. I also have my own personal Twitter account where I’ll be sharing my latest stories and any other items of interest. Finally, you can subscribe here to get my weekly blogs in your inbox.
1 Luhar A, Emmerson K, Reisen F, Williamson G, Copea E. Modelling smoke distribution in the vicinity of a large and prolonged fire from an open-cut coal mine. Atmospheric Environment, Volume 229, 15 May 2020, 117471.
2 Hazelwood Health Study, Monash University, 2016.
Featured image: Morwell Open Cut fire batter burning Feb 2014. Picture by Keith Pakenham AFSM. Used by permission from the Country Fire Authority.